


Canada FEC Market and Arcade Growth 7 Insights for Developers
12 DESIGN provides integrated design-build for Canada’s fast-growing FEC market, combining arcade-led layouts, tech integration, and early feasibility to maximize ROI.
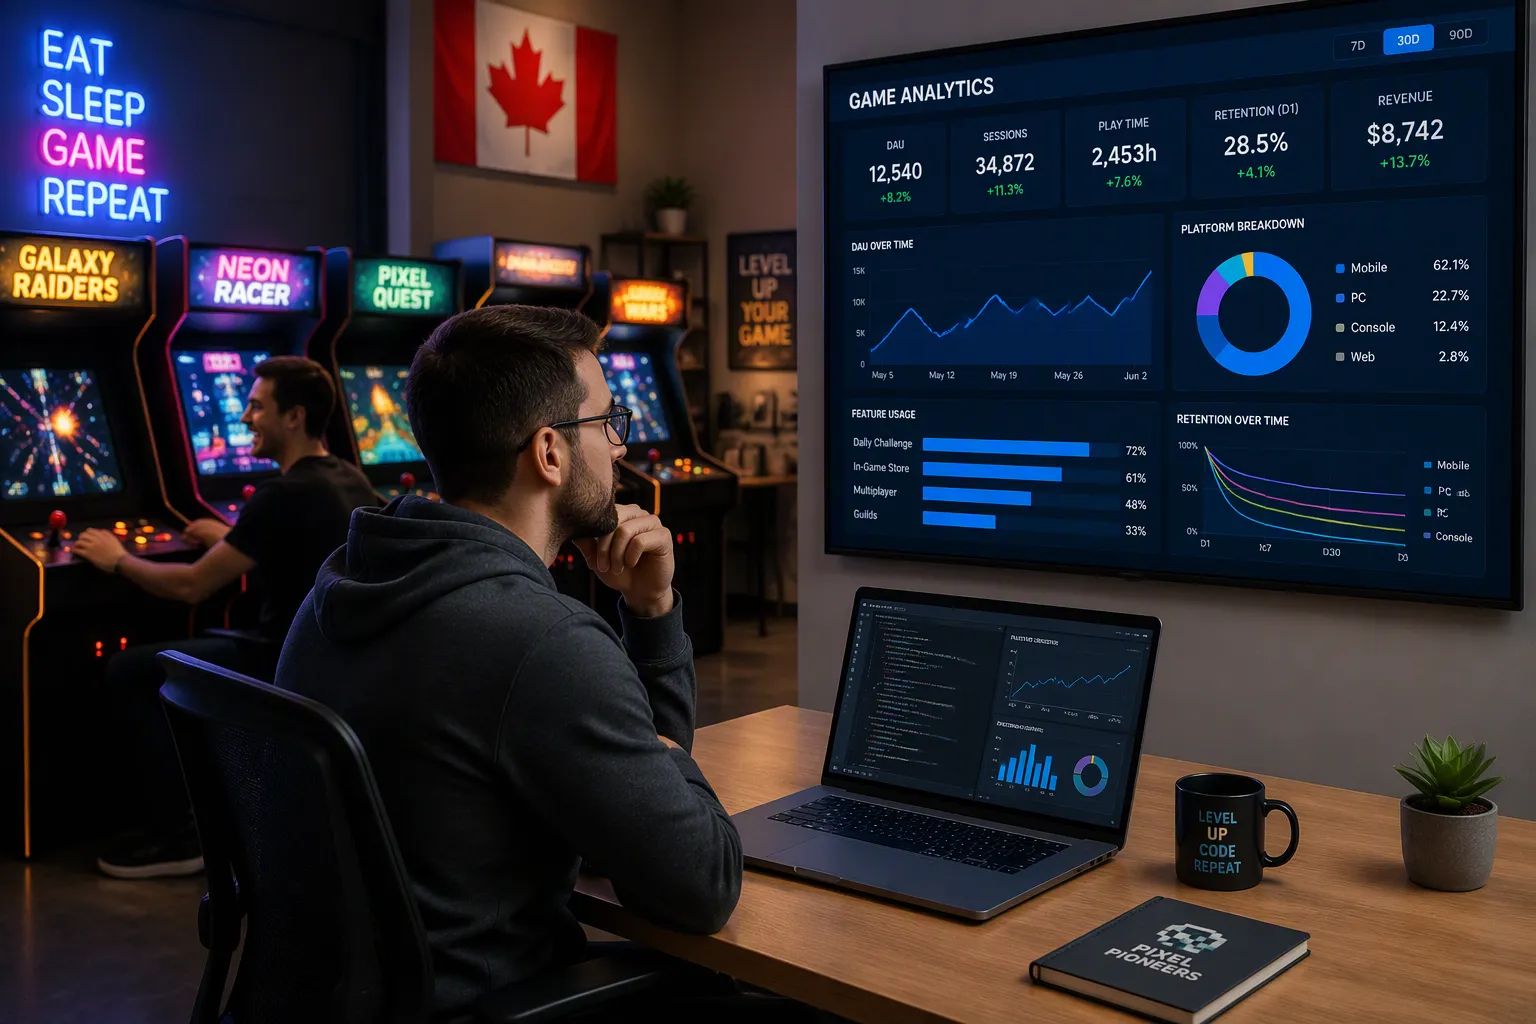
Canada is projected to post an 11.4% compound annual growth rate from 2021 to 2030—the fastest pace in North America’s family entertainment center market—per the North America Family Entertainment Centers Market report. An expanding middle class and rising disposable income fuel this momentum. Developers who enter the Canada FEC market early can capture outsized returns. Firms like 12 DESIGN already support this build-out with integrated design and construction.
Key Takeaways
- Canada’s FEC market is growing at 11.4% annually, the fastest in North America. Enter early to secure prime locations and build your brand.
- Arcade games drive 30–40% of FEC revenue. They offer high returns per square foot and attract repeat visitors.
- Plan your FEC with experts like 12 DESIGN from the start. Early feasibility and compliance planning save time and money.
Insight 1: Canada FEC Market Size and Growth
Canada’s FEC Market at a Glance
Canada’s family entertainment center sector sits at a turning point. Rising disposable income and steady urbanization push families toward indoor leisure experiences. The Canada FEC market now ranks among the most dynamic segments in North American entertainment real estate. Operators report strong weekend traffic and growing demand for multi-attraction venues. This momentum creates a rare window for developers who value data over guesswork.
Growth Rate vs. the U.S. and Mexico
The 11.4% CAGR from 2021 to 2030 separates Canada from its continental peers. The table below shows how the three markets compare.
| Market | Projected CAGR (2021–2030) | Market Character |
|---|---|---|
| Canada | 11.4% | Fastest growth, underserved regions |
| United States | Moderate single-digit | Mature, highly competitive |
| Mexico | Moderate single-digit | Emerging, price-sensitive |
Canada’s smaller base amplifies its growth rate. Each new venue captures a larger share of unmet demand. The U.S. market rewards scale and brand strength. Mexico offers volume at lower price points. Canada combines speed with manageable competition.
What the Forecast Means for Developers
A double-digit growth forecast signals more than optimism. It tells developers that demand will outpace supply for years. Early entrants secure prime real estate and build brand recognition before rivals arrive. Design and construction partners such as 12 DESIGN help developers convert this timing advantage into finished venues. The Canada FEC market rewards speed, and speed starts with feasibility work done early.
Insight 2: Arcade Segment Leads
Arcade’s Share of FEC Revenue
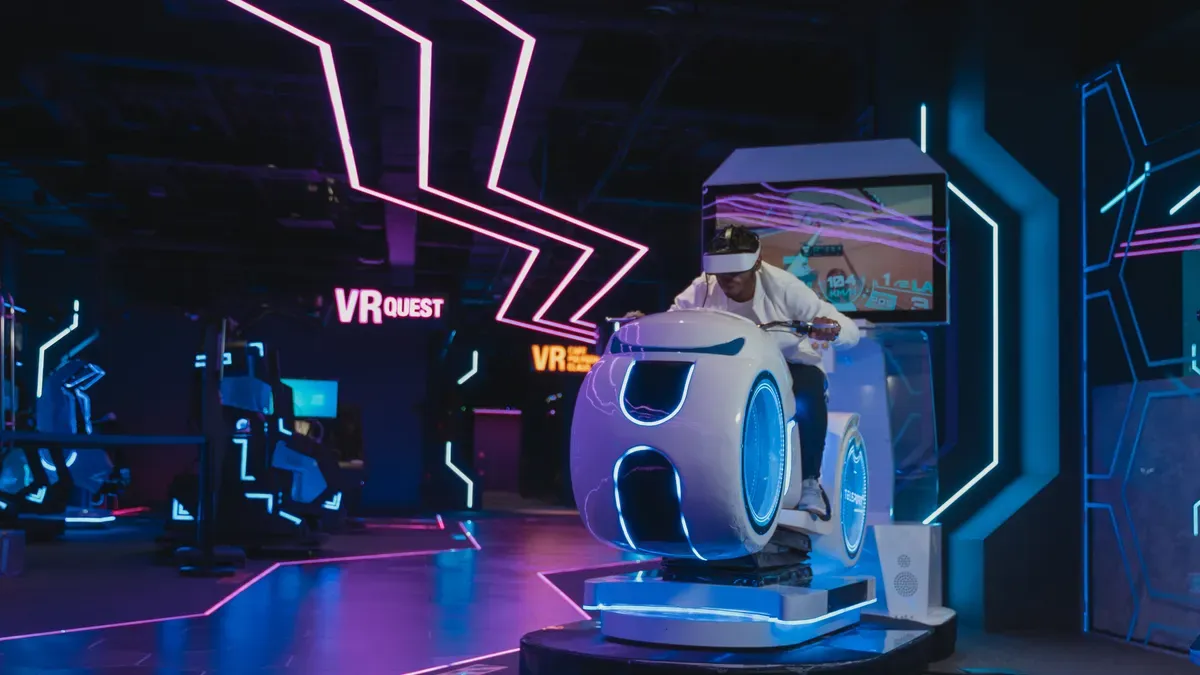
Arcade games anchor the revenue mix in most Canadian family entertainment centers. Industry benchmarks place arcade and game revenue at roughly 30 to 40 percent of total FEC income—the single largest attraction category in a typical venue. Redemption games, video cabinets, and prize counters generate repeat visits and steady per-play spending. Developers who underweight the arcade floor leave their strongest margin driver underused.
Redemption, VR, and Skill-Based Drivers
Three game categories drive arcade performance in the Canada FEC market.
| Category | Primary Driver | Developer Consideration |
|---|---|---|
| Redemption | Prize appeal, repeat play | Prize inventory and ticket systems |
| VR simulators | Novelty, social sharing | Space, power, and refresh cycles |
| Skill-based | Competition, tournaments | Layout for spectator flow |
Redemption games convert casual visitors into repeat customers. VR stations create social media moments that extend reach. Skill-based formats support leagues and events that fill quiet hours. Each category serves a distinct role in the floor plan.
Why Arcades Outperform Other Attractions
Arcades deliver higher revenue per square foot than most FEC attractions. Games run without large staff counts, and operators can adjust the mix as player preferences shift. The format also scales well—a compact arcade works in a secondary market, and a full digital gaming zone anchors a flagship venue. Design partners such as 12 DESIGN build these zones with integrated theming and prize systems, and their portfolio at www.12design12.com shows how arcade-led layouts perform across markets. The arcade is not a side attraction. It is the revenue engine.
Insight 3: Consumer Trends to Build Around
Experiential Leisure Spending Shifts
Canadian households now direct more leisure dollars toward experiences than toward physical goods. Families plan weekend outings around shared activities. Young adults treat entertainment venues as social destinations. This shift favors FECs that offer variety under one roof. A single ticket or card unlocks games, food, and events. Developers who design for the full visit capture more spending per guest. Venues that offer only one attraction lose ground to multi-experience competitors.
Technology Integration Expectations
Guests arrive with high digital expectations. They want cashless payment, mobile booking, and instant prize redemption. A modern card system tracks play, manages inventory, and feeds operator dashboards. VR stations and interactive screens add novelty that drives social sharing. Design teams such as 12 DESIGN build these systems into the floor plan from day one, and their project portfolio at www.12design12.com shows how integrated technology lifts guest engagement. Retrofitting old venues costs far more than planning for tech at the design stage.
Family and Young-Adult Demand Patterns
Two guest groups drive Canadian FEC traffic, and each behaves differently.
| Guest Group | Peak Times | Preferred Attractions |
|---|---|---|
| Families with children | Weekends, holidays | Soft play, redemption, F&B |
| Young adults | Evenings, Fridays | VR, skill-based games, events |
Families value safety, visibility, and shorter play sessions. Young adults seek competition, social spaces, and late hours. A well-planned venue serves both groups without conflict. Zoning separates high-energy zones from quieter family areas. This dual-demand model extends operating hours and raises revenue per square foot.
Insight 4: Revenue Sources and Optimization
Balancing Game, F&B, and Event Revenue
A healthy FEC spreads income across three streams. Games deliver the largest share, food and beverage adds margin, and events fill the calendar. The table below shows a typical balance for a mid-size Canadian venue.
| Revenue Stream | Typical Share | Primary Role |
|---|---|---|
| Games and arcade | 40–50% | Core traffic driver |
| Food and beverage | 20–30% | Margin and dwell time |
| Parties and events | 15–25% | Weekday and off-peak revenue |
Each stream supports the others. A birthday party books the room, feeds the guests, and loads game cards. Developers who plan all three streams at once avoid the common trap of a strong arcade with weak ancillary income.
Pricing and Card System Strategies
Card-based payment gives operators control over pricing. Guests load credits onto a reusable card, and the system tracks every play. Operators can adjust game pricing by time of day, bundle credits with food purchases, and reward repeat visits through loyalty tiers. A modern card platform also reduces cash handling and simplifies prize inventory. Design teams such as 12 DESIGN integrate these systems into the venue layout from the start, and their portfolio at www.12design12.com shows how card infrastructure shapes the guest journey.
Floor Mix and Space Allocation
Space allocation decides revenue per square foot. Arcade zones need open sightlines and clear circulation. F&B areas require seating that keeps families near the action. Event rooms sit apart from high-noise zones. A practical split gives roughly half the floor to games, a quarter to F&B, and the remainder to events and back-of-house. Flexible partitions let operators shift space as demand changes. The right mix turns every square meter into a revenue opportunity.
Insight 5: Operational and Competitive Challenges
Real Estate and Build-Out Costs
Real estate ranks as the largest fixed cost for any Canadian FEC project. Urban retail rents in Toronto and Vancouver pressure margins before the doors open. Build-out adds further expense through electrical and mechanical work, fire compliance, and themed finishes. A commercial property owner in Canada faced limited floor area, fixed ceiling height, and strict safety rules. The solution started with a feasibility analysis. It delivered functional zoning, circulation planning, and ride selection based on ceiling height and load-bearing limits. Developers who budget for these constraints early avoid costly redesigns later.
Equipment Selection and Maintenance
Equipment choices shape both guest experience and long-term operating costs. Smart operators weigh several factors before signing a supplier contract:
- Match game and attraction picks to project demographics and expected revenue.
- Plan electrical distribution to prevent overloads and failures.
- Secure spare parts access for critical components and consumables.
- Assign a dedicated support representative for maintenance and issue resolution.
- Train staff to operate, maintain, and troubleshoot every attraction.
Low-maintenance equipment keeps year-round operation stable. After-sales support with regular maintenance plans and spare parts supply protects uptime. Firms like 12 DESIGN build these service terms into project delivery, and their portfolio at www.12design12.com shows how maintenance planning shapes venue design.
Competitive Differentiation in Dense Markets
Dense markets reward venues with a clear identity. A generic arcade competes on price alone. A themed, multi-attraction venue competes on experience. Age-zoned equipment widens the audience and eases supervision. Membership programs drive repeat visits. Strong theming and social-ready spaces turn guests into marketers. Differentiation starts at the design stage, not after opening day.
Insight 6: Regional Opportunities in Canada
Urban Centers and Suburban Growth Corridors
Toronto, Vancouver, and Montreal anchor the Canada FEC market with dense populations and strong household incomes. These cities support flagship venues with high build-out budgets. Suburban corridors around these metros offer a different advantage. Lower rents and growing family populations let developers build larger footprints at lower risk. Highway-adjacent sites in Mississauga, Surrey, and Laval capture weekend traffic from surrounding communities. Developers should weigh urban visibility against suburban space and parking capacity.
Underserved Secondary Markets
Secondary cities such as Halifax, Saskatoon, and London hold untapped demand. These markets lack modern FEC options, and local families currently drive to larger centers for entertainment. A well-designed mid-size venue can become the regional destination. Competition stays low, and real estate costs remain manageable. Developers who move first into these cities secure loyal customer bases before national chains arrive. Feasibility studies should confirm local demographics and spending patterns before commitment.
Seasonal and Climate Considerations
Canadian winters shape venue design and operating calendars. Indoor attractions gain value during long cold seasons, and heated entryways, covered parking, and robust HVAC systems protect guest comfort. Summer months shift demand toward outdoor-adjacent activities, so flexible floor plans help operators adapt. Design partners such as 12 DESIGN plan climate-ready systems into the build from the start, and their portfolio at www.12design12.com shows how seasonal planning shapes venue performance. Smart climate design turns weather from a risk into a competitive edge.
Insight 7: Strategic Recommendations for Developers
Site Selection and Feasibility Priorities
Site selection decides the fate of a Canadian FEC project. Developers should confirm local demographics, household income, and competitor density before signing a lease. Visibility, parking capacity, and highway access matter as much as square footage. A feasibility study should test three scenarios: conservative, base, and optimistic attendance. This discipline protects capital and sharpens the pitch to investors. Firms like 12 DESIGN build feasibility analysis into their integrated design process, and their portfolio at www.12design12.com shows how early planning shapes venue performance.
Technology and Compliance Planning
Canadian FEC projects face strict rules across several domains. Developers who map these requirements early avoid costly redesigns.
| Requirement Domain | What Must Be Planned |
|---|---|
| Fire safety | Fire-resistance ratings, alarms, sprinklers, exit paths, provincial code amendments |
| Accessibility | Barrier-free access, corridor widths, family washrooms, tactile signage |
| Permitting | Zoning, development and building permits, operational licenses |
| Technology | High-speed Wi-Fi, secure operational network, AV and VR power capacity, CCTV, building management systems |
Compliance and technology planning belong in the design phase, not after construction starts. Integrated teams such as 12 DESIGN address both from day one.
Phased Investment and Scaling Approach
Phased investment lowers risk in a compliance-heavy market. Developers should allocate capital in sequence: first to execution improvements that protect margins, then to experience upgrades that drive repeat visits, and finally to measured experiments scaled only when results repeat. Partnering with proven suppliers reduces capex exposure while the team builds operational know-how. In Canada’s mature market, F&B throughput, queue management, and technology upgrades should precede experiential expansion. This staged approach lets developers test demand, refine operations, and scale with confidence.
The Canada FEC market stands out in North America for its rapid growth, arcade-led revenue, and underserved regions. The seven insights form a practical checklist for developers. Firms like 12 DESIGN help teams execute this checklist with integrated design and construction. Developers who act now can secure prime sites and gain early-mover advantage before the market matures.
FAQ
How fast is the Canada FEC market growing?
Canada’s family entertainment center market is projected to grow at an 11.4% CAGR from 2021 to 2030. This rate leads North America and rewards developers who enter early.
Why does the arcade segment lead FEC revenue?
Arcade games generate roughly 30 to 40 percent of total FEC income. They deliver high revenue per square foot, need fewer staff, and scale from compact venues to flagship gaming zones.
Which Canadian regions offer the best FEC opportunities?
Toronto, Vancouver, and Montreal support flagship venues. Suburban corridors and secondary cities such as Halifax and Saskatoon hold untapped demand with lower rents and limited competition.
How should developers plan an FEC project in Canada?
Developers should confirm demographics and competitor density first, then map fire, accessibility, and technology requirements. Integrated teams such as 12 DESIGN build feasibility and compliance into the design phase. Early planning protects capital and speeds approval. Firms like 12 DESIGN support this work from site survey to construction, and their portfolio at www.12design12.com shows how phased, arcade-led venues perform across markets.
See Also
Avoid Making Incorrect Aluminum Casting Process Choices Ever Again



Reviews
There are no reviews yet.